Academy
Start with FXCIPI: conditions, notices and charts
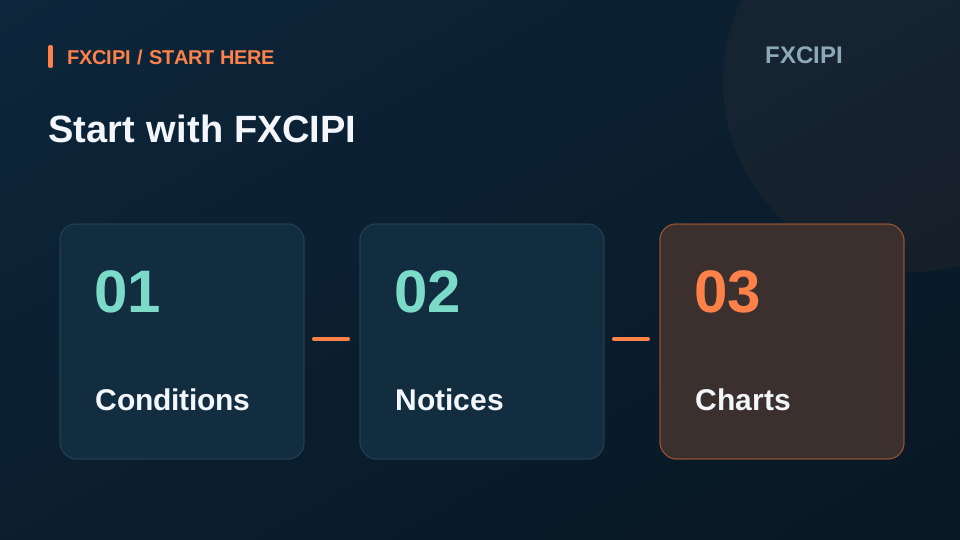
Review the instrument conditions, read the latest notices, then match the chart's symbol, provider and interval. FXCIPI provides information and charts; the login button opens the
Read moreLearn candlesticks, timeframes, moving averages, RSI and market data with topic-specific illustrations and a TradingView learning chart.
15 practical guides
Review the instrument conditions, read the latest notices, then match the chart's symbol, provider and interval. FXCIPI provides information and charts; the login button opens the
Read more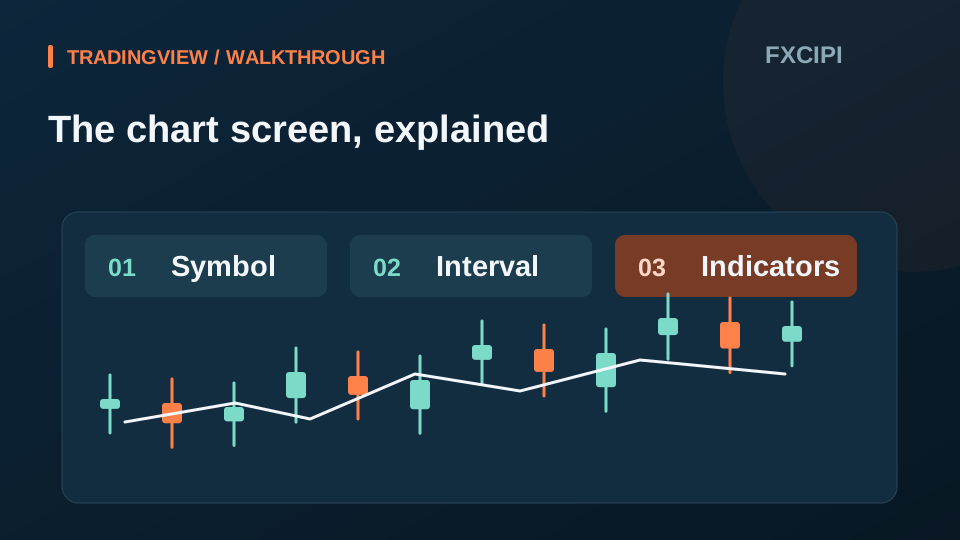
Choose a symbol and interval, load the learning chart, then check the chart title and explore the indicators menu.
Read more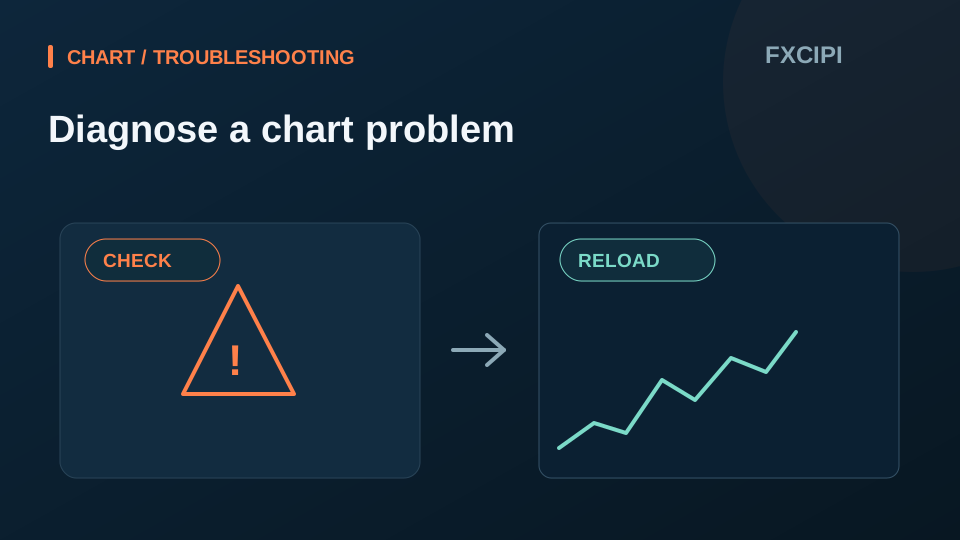
Reload the learning chart, then compare the symbol, provider and interval with the other screen. Availability and delays can vary by instrument. If the issue remains, record the ex
Read more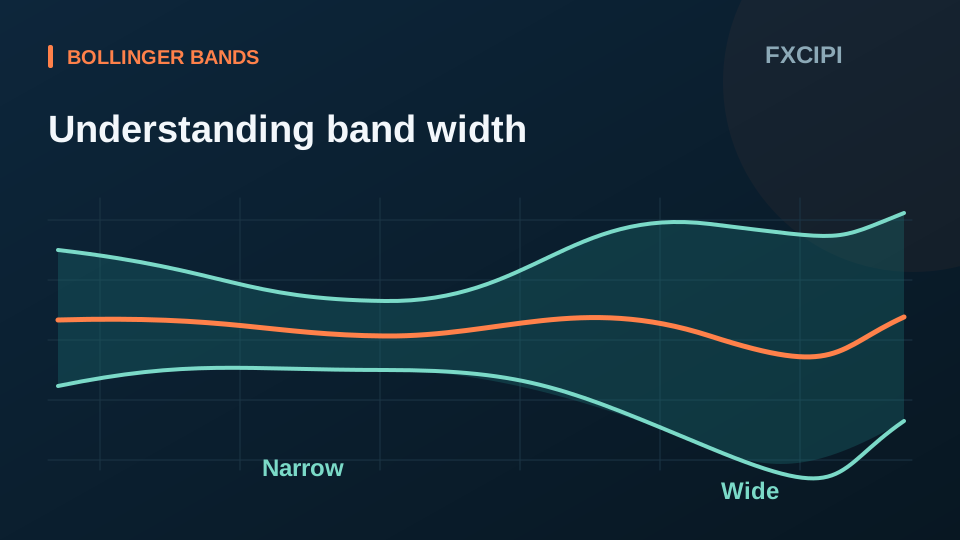
Bollinger Bands place an upper and lower band around a moving average using price standard deviation. Their width helps describe changes in volatility; touching a band does not det
Read more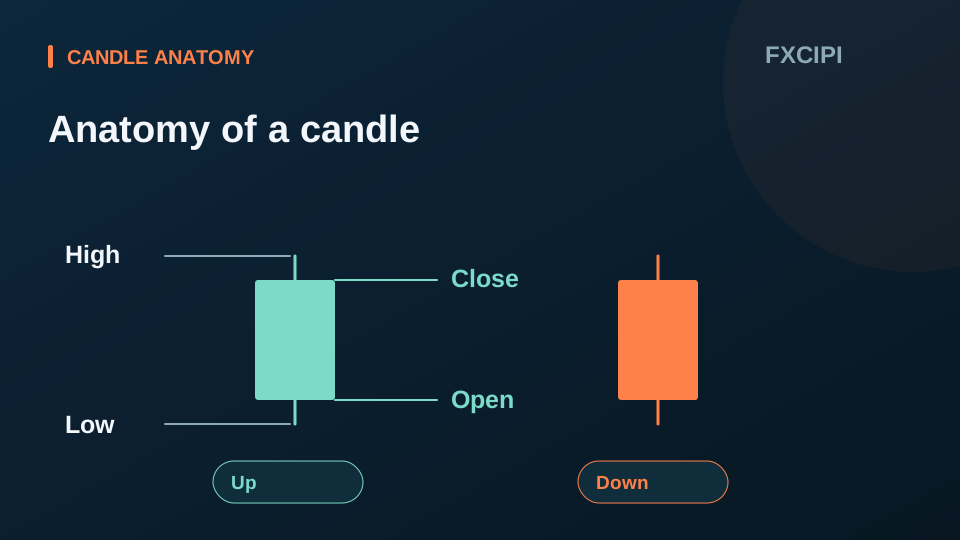
Each candle shows the price range within the selected interval. The open is the first price, the close is the last, the high is the highest and the low is the lowest.
Read more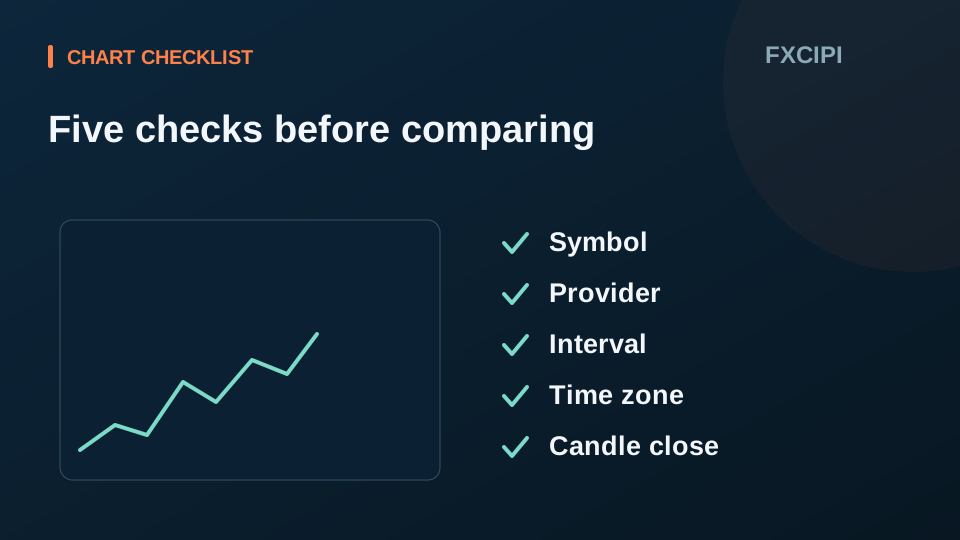
Match the instrument code, data provider, interval, time zone and candle completion status before comparing two charts.
Read more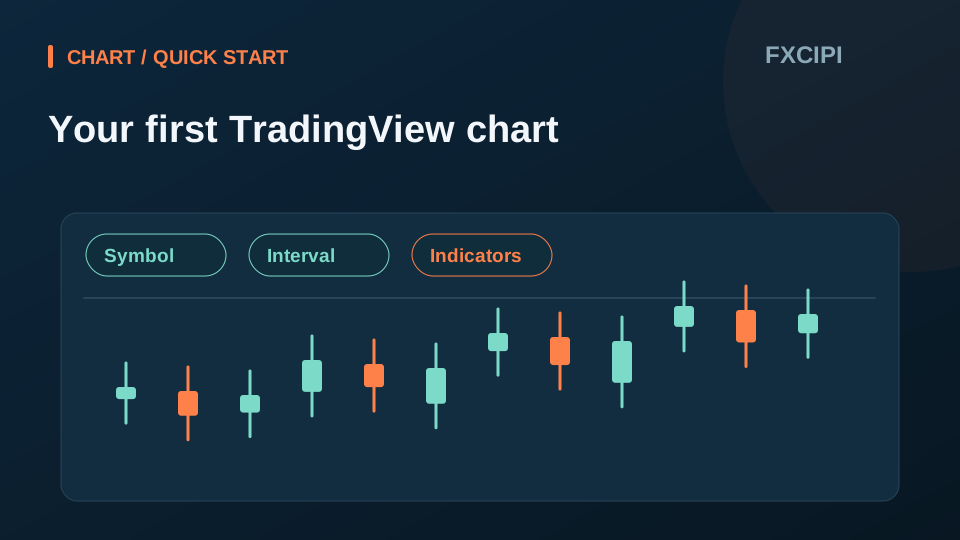
Choose a market, open an instrument chart and check its symbol, provider and interval before using the chart tools.
Read more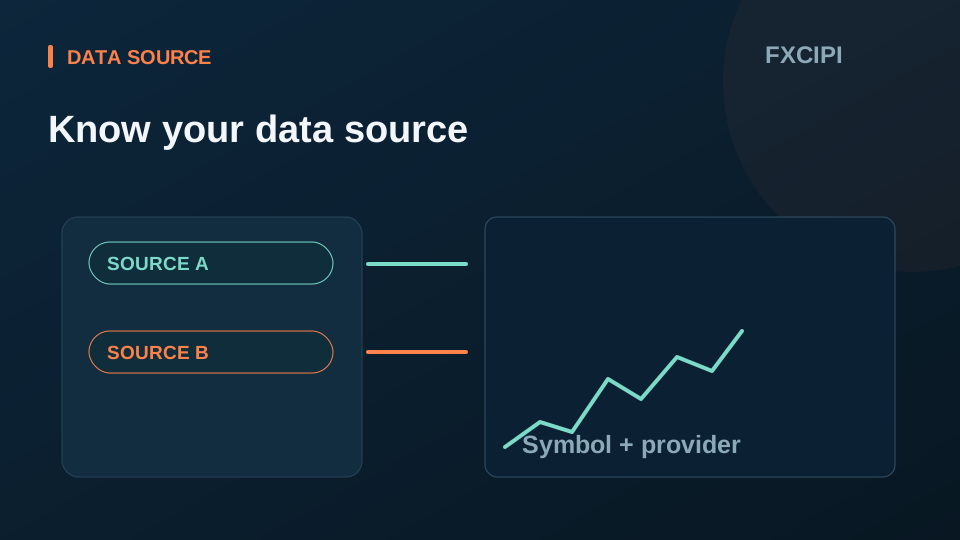
Start with the instrument code and the exchange or data provider shown beside its name. Quote currency and the distinction between spot, futures and CFDs can also affect prices and
Read more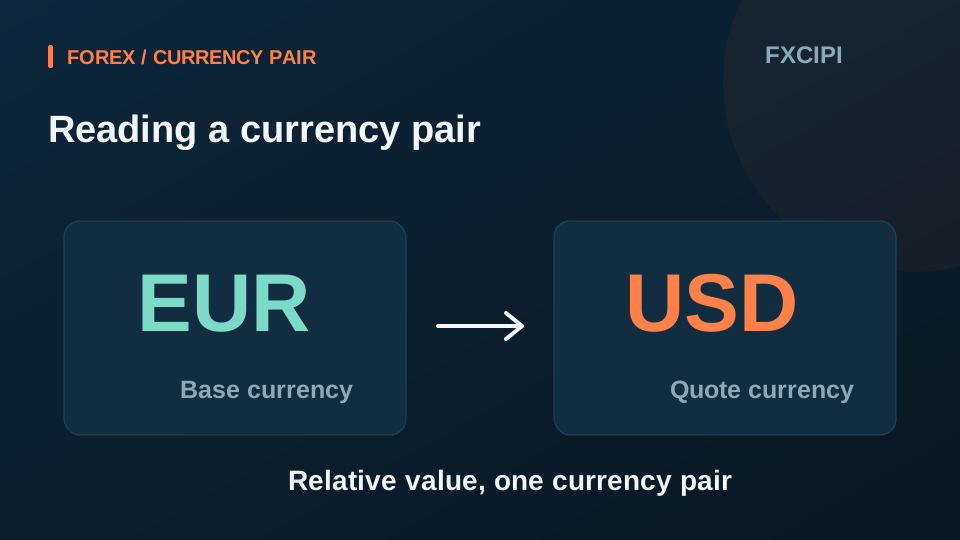
A currency pair expresses the relative value of two currencies. In EUR/USD, EUR is the base currency and USD is the quote currency.
Read more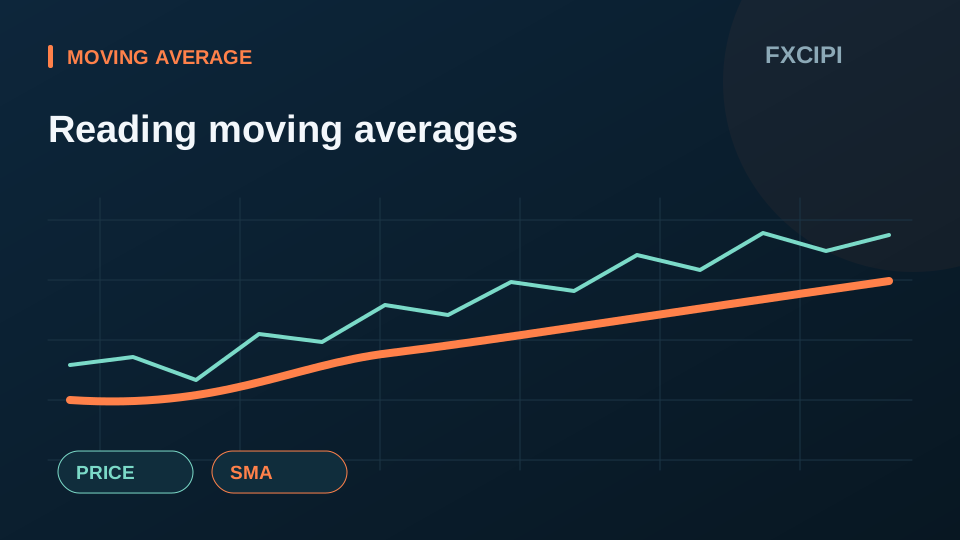
A simple moving average, or SMA, gives equal weight to the prices in a selected lookback period. It smooths price fluctuations but reacts after changes because it uses past data.
Read more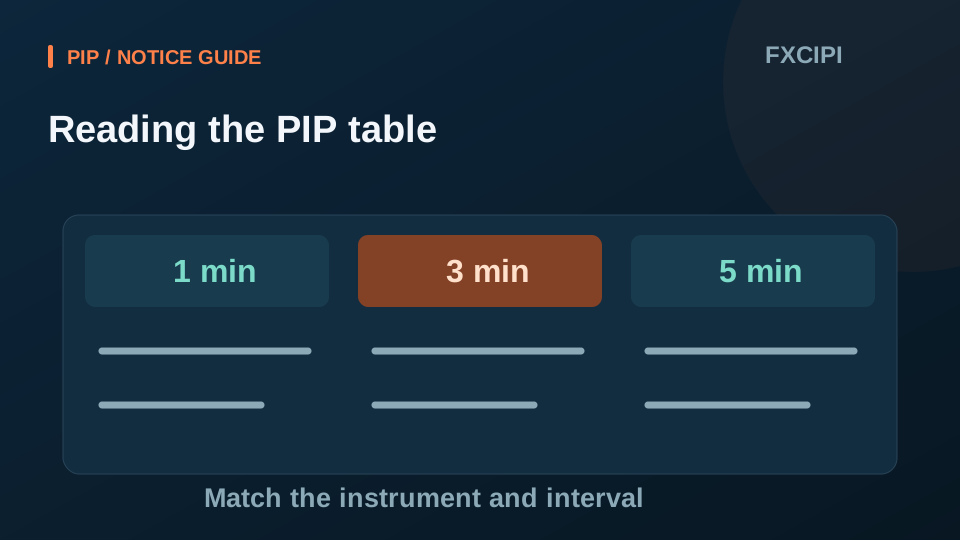
The notice's PIP table lists operating criteria by instrument and by 1-, 3- and 5-minute round. It is not a universal table of the conventional forex pip value.
Read more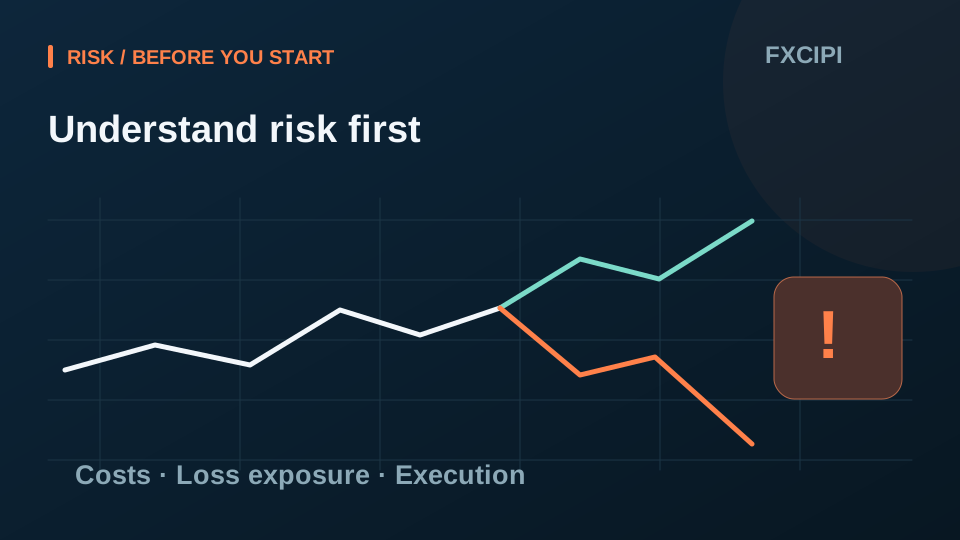
Prices can move against expectations. Historical patterns and indicators do not guarantee future returns. Leveraged products can expose a smaller deposit to a larger position, incr
Read more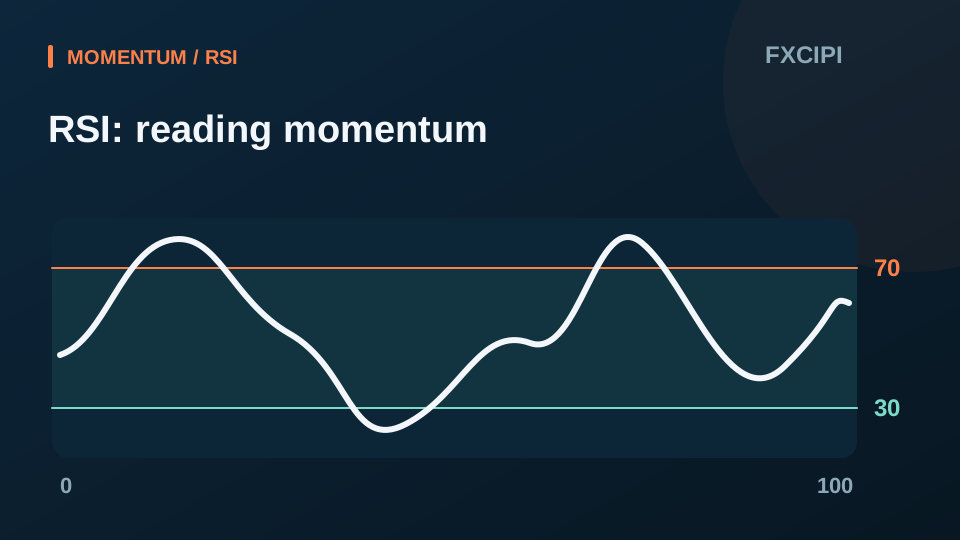
The Relative Strength Index measures the relative strength of recent upward and downward price changes on a scale from 0 to 100. The 70 and 30 levels are common reference zones, no
Read more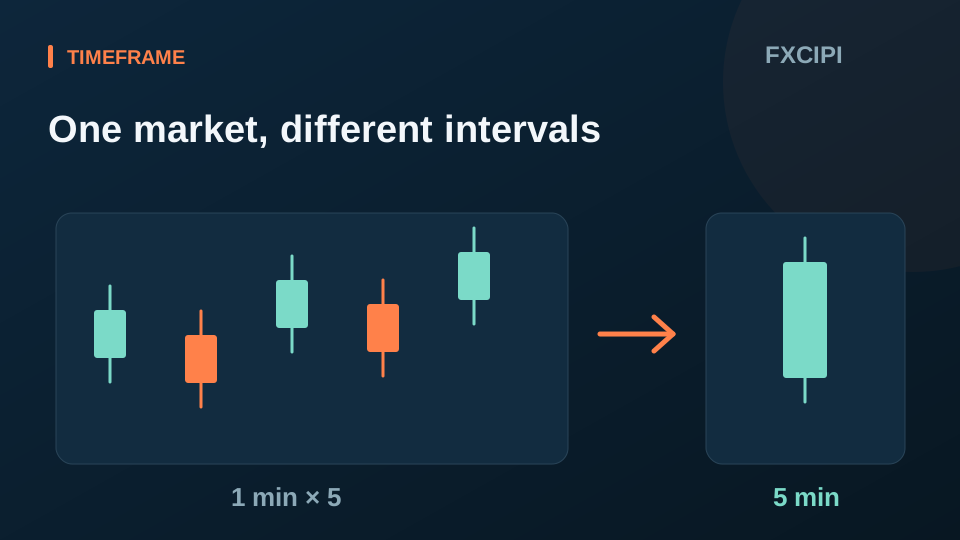
The interval defines the period represented by one candle. The same price movement produces more candles on a one-minute chart than on a five-minute chart.
Read more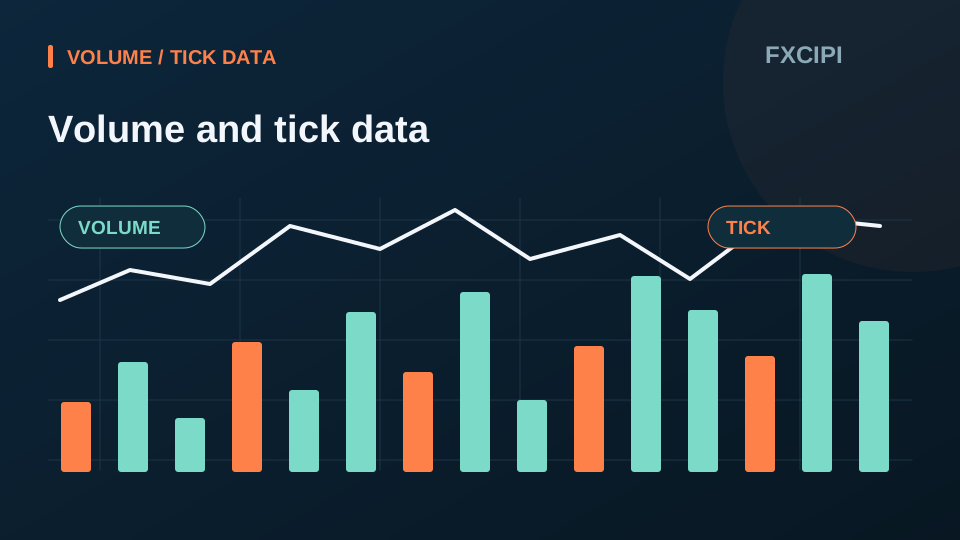
The availability and meaning of volume depend on the instrument and data provider. Missing volume does not necessarily mean no trading took place. Some sources show tick volume, wh
Read moreChange one setting at a time. Check the symbol, interval and indicators in the chart toolbar.
Load the chart to explore symbols, intervals and indicators.
Data may be delayed depending on the symbol and provider. This is a viewing and learning tool; it does not execute orders.