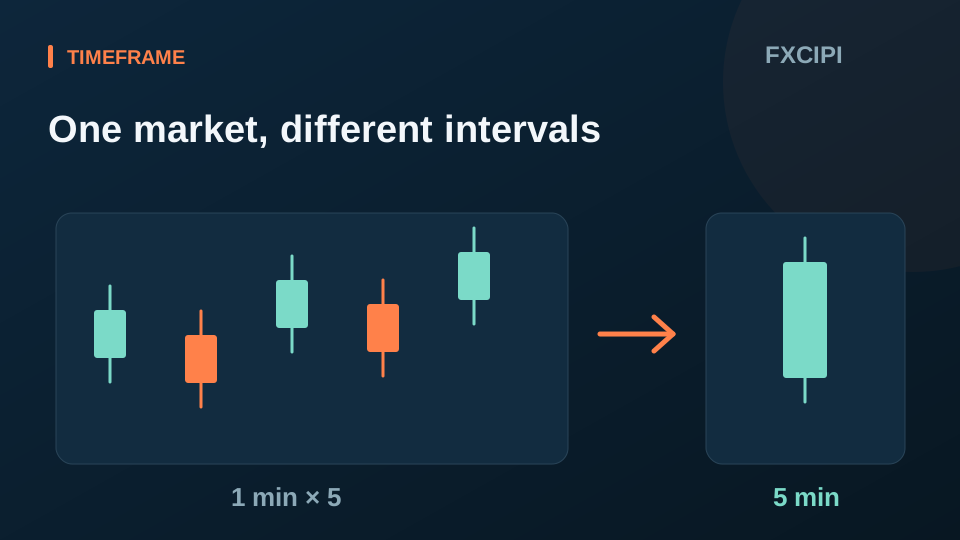
The interval defines the period represented by one candle. The same price movement produces more candles on a one-minute chart than on a five-minute chart.
Combining intervals
Five consecutive one-minute candles can form a five-minute candle: its open is the first open, its close is the final close, and its high and low are the extremes across the group. Align the time boundaries when comparing.
What changes on screen
A shorter interval reveals more detail; a longer interval aggregates it. Indicator periods are counts of candles, so the same numerical setting covers a different amount of time when the interval changes.
Before comparing
Match the symbol, source, time zone and candle boundaries. Check whether the most recent candle is complete.