
FXCIPI   GLOBAL MARKETS · CHARTS · EDUCATION
FXCIPI illustration of connected global markets
YOUR PERSPECTIVE. YOUR POSSIBILITIES.

Global markets.
Your next perspective.

Market charts, operating notices and practical learning.
Build your understanding with FXCIPI.

POWERED BY CURIOSITY · INFORMED BY DATA
GLOBAL MARKETS

Your view of the market.

Choose a reference instrument and explore its chart.

CHART WORKSHOP

Put your learning into practice.

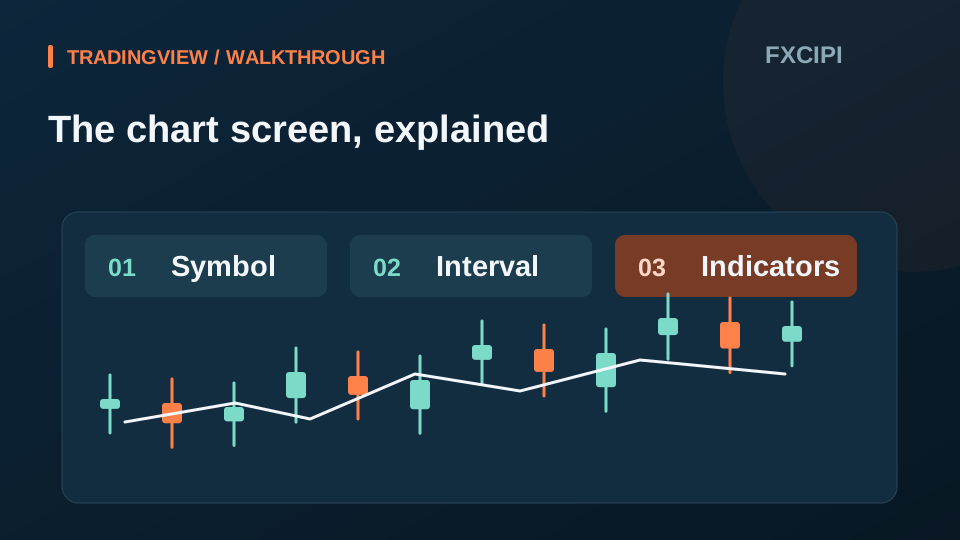
Change one setting at a time. Check the symbol, interval and indicators in the chart toolbar.

TradingView learning chart

Load the chart to explore symbols, intervals and indicators.

Data may be delayed depending on the symbol and provider. This is a viewing and learning tool; it does not execute orders.

START WITH FXCIPI

Start with a clear understanding.

YOUR PLATFORM

Research here.
Access your service with FXLand.

Read instrument conditions and current notices before continuing. The Login button opens the external FXLand website, where account procedures and trading terms apply.

Open FXLand
THE FXCIPI APPROACH

Understand the context behind the chart.

01 / SOURCE

Know your data

Check the provider, instrument and interval before comparing prices.

02 / CONTEXT

Read the conditions

Distinguish published operating references from a chart used for browsing.

03 / LEARNING

Build your own understanding

Use explanations and interactive charts to explore how market data works.

FXCIPI ACADEMY

Learn the language of charts.

All learning resources
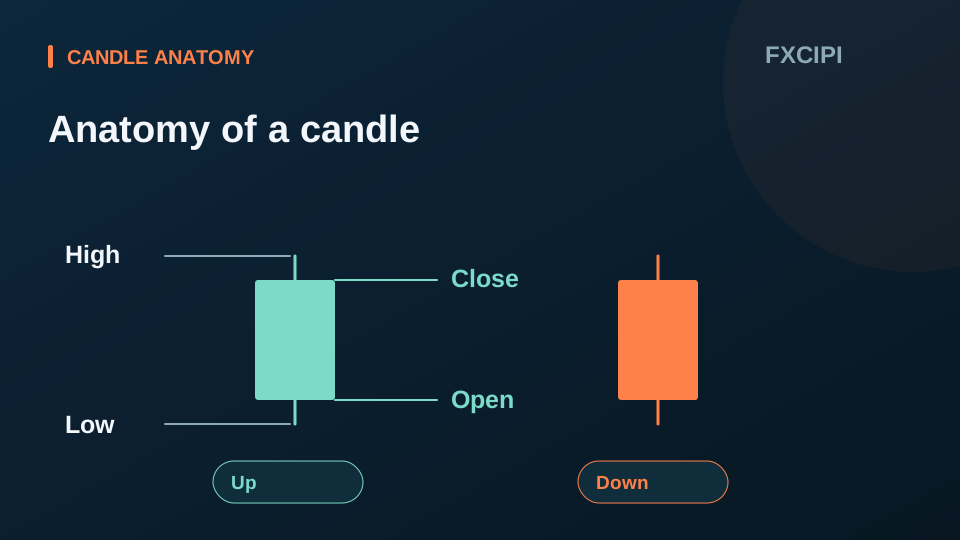
Reading open, high, low and close — concept illustration
Academy

Reading open, high, low and close

Each candle shows the price range within the selected interval. The open is the first price, the close is the last, the high is the highest and the low is the lowest.

Read more
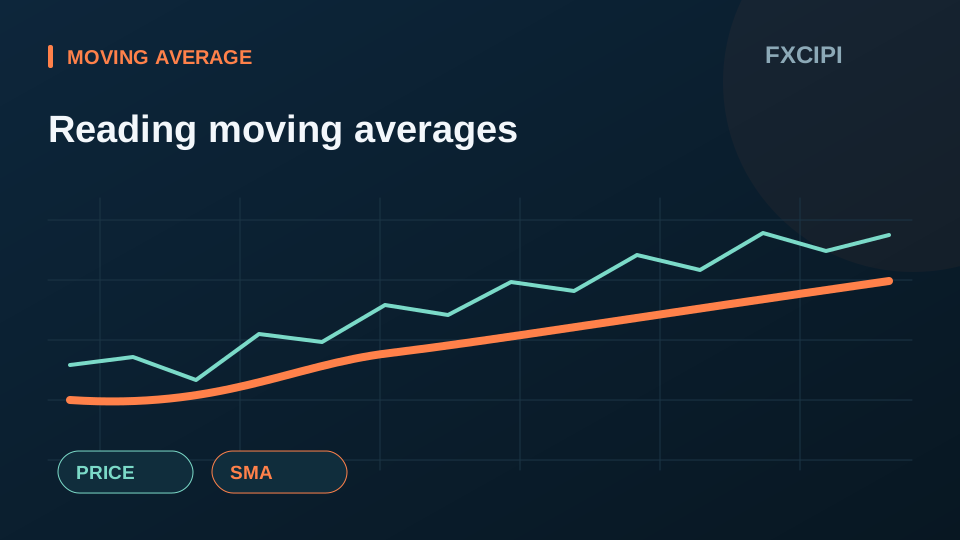
Reading a simple moving average — concept illustration
Academy

Reading a simple moving average

A simple moving average, or SMA, gives equal weight to the prices in a selected lookback period. It smooths price fluctuations but reacts after changes because it uses past data.

Read more

Frequently asked questions

All questions
When are market briefings updated?

Briefings are editorial content with publication and update dates. They are not currently published automatically each week. The operator reviews and publishes them. Historical briefings are not live prices or current operating terms. The calendar loads provider data when opened.
Is the economic calendar in Korean time?

Check the time zone displayed inside the widget. The page also identifies the Korean time zone separately. Convert times when the widget and original publisher use different zones, and account for daylight saving where relevant.

Why do prices differ for the same instrument?

The provider, quote currency, interval or observation time may differ. The operating notices reference OANDA for FX and BINANCE for crypto. Match the provider and check whether the candle is still forming.

Quick menu