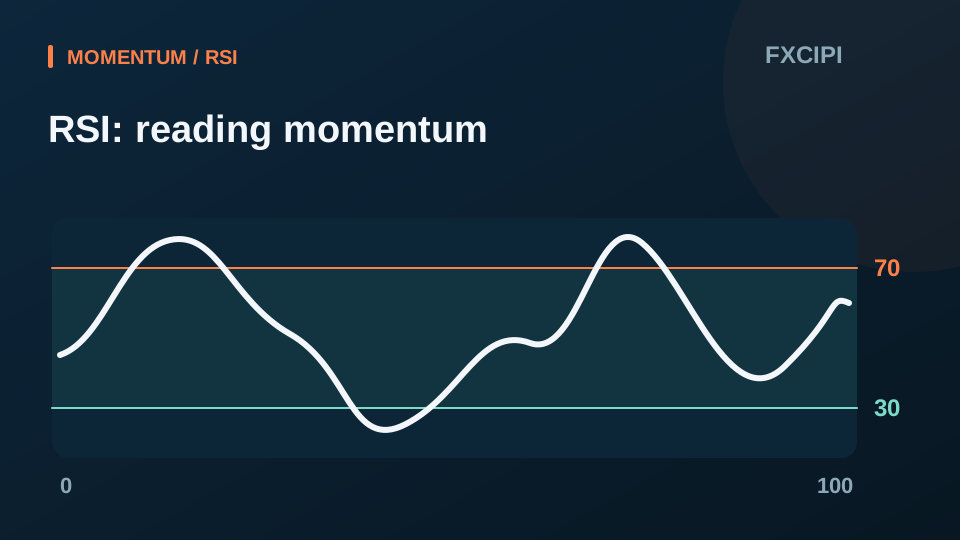
The Relative Strength Index measures the relative strength of recent upward and downward price changes on a scale from 0 to 100. The 70 and 30 levels are common reference zones, not guaranteed reversal signals.
Reading the scale
A higher reading reflects stronger recent upward movement relative to downward movement under the selected calculation. A lower reading reflects the reverse. The lookback setting affects sensitivity.
Why a level is not a trading instruction
RSI can remain elevated or depressed during a sustained trend. A reading near 70 or 30 alone cannot establish when price will reverse.
Practise with consistent settings
Compare RSI with the price chart using the same symbol, provider and interval. Check the lookback period and whether the current candle has closed. Record observations rather than treating a threshold as a promise.