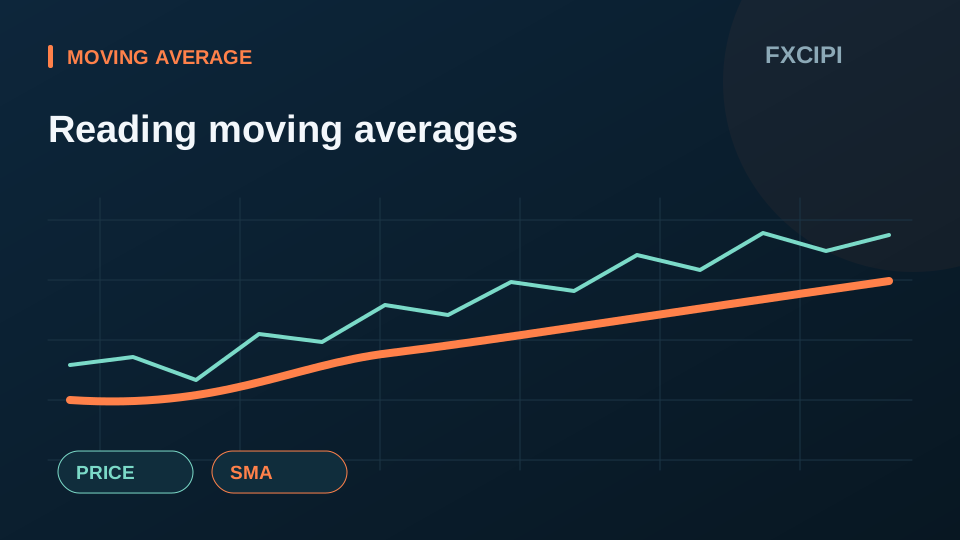
A simple moving average, or SMA, gives equal weight to the prices in a selected lookback period. It smooths price fluctuations but reacts after changes because it uses past data.
How the average works
Add the prices in the chosen period and divide by their count. As a new period arrives, the oldest observation leaves the calculation. A shorter lookback reacts more quickly; a longer one generally changes more gradually.
What to compare
Keep the symbol, data source, chart interval, price input and lookback length consistent. A 20-period SMA on a one-minute chart covers a different span from a 20-period SMA on an hourly chart.
Practise on the chart
Add an SMA, inspect its settings and compare its path with the price. Observe a rising, falling and sideways section. A crossover or position above the average does not guarantee a future move.