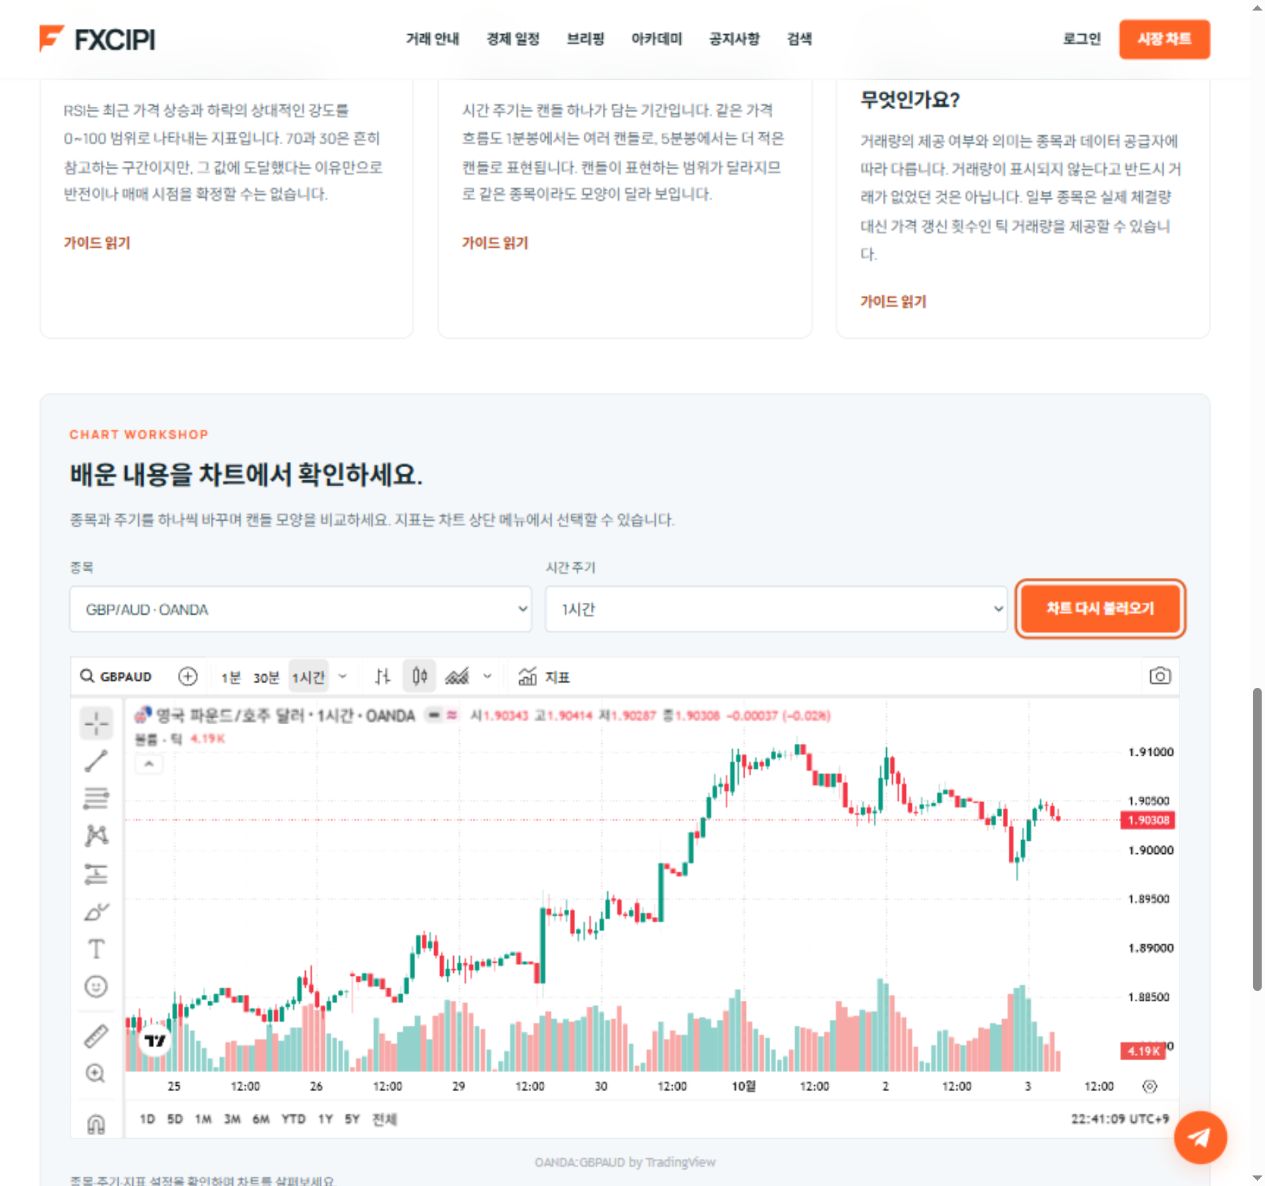
About the screen example
The recorded screen was captured on October 3, 2026 with GBP/AUD from OANDA at a one-hour interval. Its prices are historical screen values, not current quotes. The recorded interface is in Korean; the interactive chart below uses English.
1. Select a symbol and provider
Choose GBP/AUD · OANDA in the Symbol selector. GBP/AUD is the currency pair and OANDA is the provider. BTC/USDT and ETH/USDT are available from BINANCE. Confirm the current symbol and provider in the chart title after loading or changing a symbol inside the widget.
2. Choose an interval
Select 1 hour and press Load learning chart. Each candle covers one hour. The outer selector also offers 1, 3 and 5 minutes and 1 day. The chart's own toolbar has interval controls, some of which may collapse on smaller screens.
Changing an outer selector reloads the widget and can reset added indicators or other settings. To compare within the same widget, try the controls inside the chart.
3. Read the candle and market status
Open, high, low and close describe a candle's prices. Distinguish a past candle under the cursor from the latest candle. A market-closed indicator can explain a price that is no longer updating. Check the time zone and whether the candle has closed.
4. Explore indicators
Open Indicators in the chart toolbar, search the available list and check an indicator's settings after adding it. Availability depends on the widget. Start with one indicator and compare it with price; the SMA and RSI academy articles explain the concepts.
5. Check your setup
- Confirm the symbol and provider.
- Match the interval in the chart title.
- Distinguish a completed candle from one still forming.
- Check the time zone and market status.
- Use Reload chart or the TradingView source link if the chart does not display.
This learning chart is for viewing and practice, and does not execute orders.