Academy
Getting started with TradingView charts
FXCIPI ACADEMY · CHARTS & MARKET DATA
Choose a market, open an instrument chart and check its symbol, provider and interval before using the chart tools.
A practical sequence
- Select a market category on the homepage and open a chart.
- Use the instrument selector or symbol search to choose a symbol.
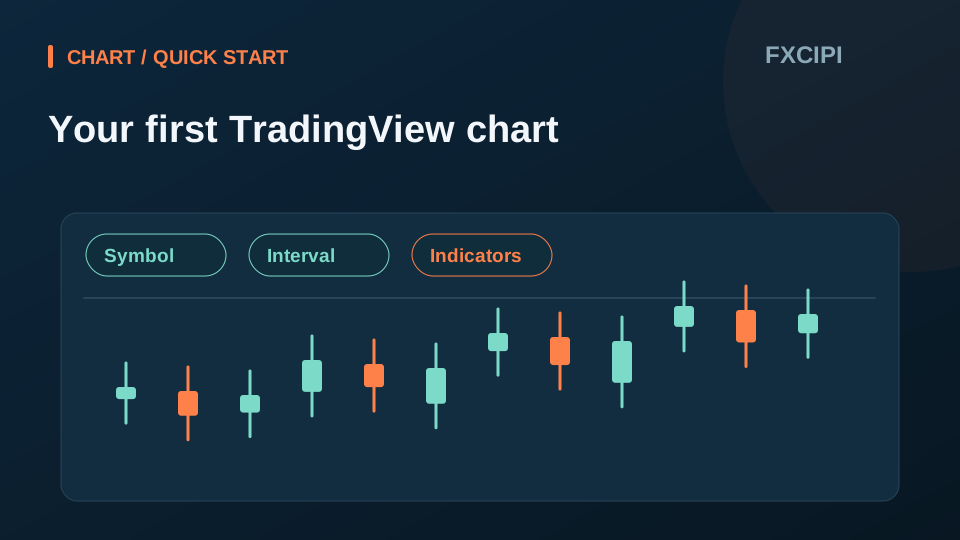
- Check the interval: a one-minute candle and a one-hour candle cover different periods.
- Explore chart styles and the indicators menu. Some controls may collapse on a narrow screen.
- Check the source and any delay message. If the widget does not display, use its TradingView link.
The charts are for market viewing. Account access, execution, deposits and withdrawals are not performed in this website's chart widget.
CHART WORKSHOP
Put your learning into practice.
Change one setting at a time. Check the symbol, interval and indicators in the chart toolbar.
TradingView learning chartLoad the chart to explore symbols, intervals and indicators.
Data may be delayed depending on the symbol and provider. This is a viewing and learning tool; it does not execute orders.