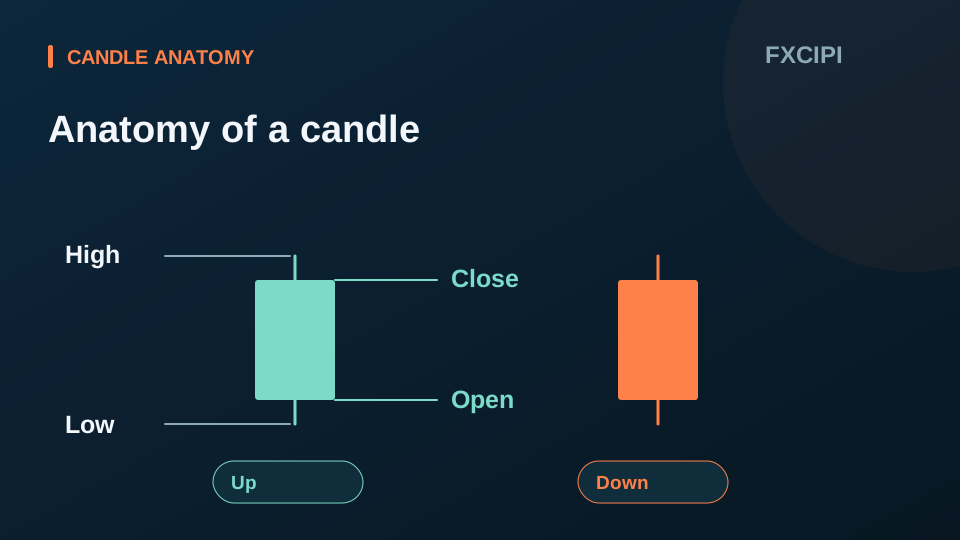
Each candle shows the price range within the selected interval. The open is the first price, the close is the last, the high is the highest and the low is the lowest.
The body shows the relationship between open and close. The wicks extend to the high and low.
A candle can still be forming
The close, high and low of the current candle may change until the interval ends. Distinguish a completed candle from one still forming, and do not compare different intervals as if they represented the same period.
CHART WORKSHOP
Put your learning into practice.
Change one setting at a time. Check the symbol, interval and indicators in the chart toolbar.
TradingView learning chart
Load the chart to explore symbols, intervals and indicators.
Data may be delayed depending on the symbol and provider. This is a viewing and learning tool; it does not execute orders.