A currency pair expresses the relative value of two currencies. In EUR/USD, EUR is the base currency and USD is the quote currency.
For example, EUR/USD at 1.08 means one euro is worth 1.08 US dollars. This is an explanatory example, not a current quote.
Before comparing pairs
Check which currency comes first and which comes second. Also confirm the provider, instrument type and quote time. Reversing the pair changes how the number is interpreted.
Calculate the spread
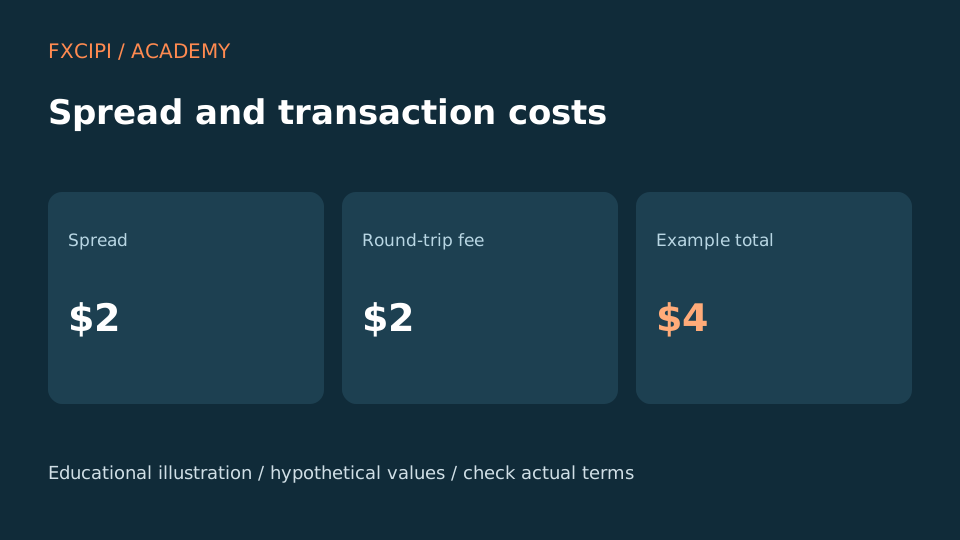
Assume an illustrative EUR/USD bid of 1.0800 and ask of 1.0802. With one pip defined as 0.0001 in this example, the spread is two pips. Buying EUR 10,000 at the ask and immediately selling at the unchanged bid produces a USD 2 price loss. Check the actual contract size and conversion method separately.
Add costs without counting twice
If a hypothetical USD 1 commission applies on entry and another USD 1 on exit, the total is USD 2 spread plus USD 2 commissions, or USD 4. Do not subtract the spread again if profit or loss already uses actual entry and exit prices. Financing and currency conversion may add separate costs. These are invented examples, not FXCIPI or linked-service fees.
Slippage and order types
An expected buy at 1.0802 that fills at 1.0803 has USD 1 adverse slippage for EUR 10,000. Slippage can also be favorable. Market orders do not guarantee price; limit orders constrain price but do not guarantee execution. Check the service-specific order rules.
What to record
- Instrument, contract size and account currency.
- Bid and ask at the same time.
- Entry, exit, financing and conversion charges.
- Expected and actual fill prices.