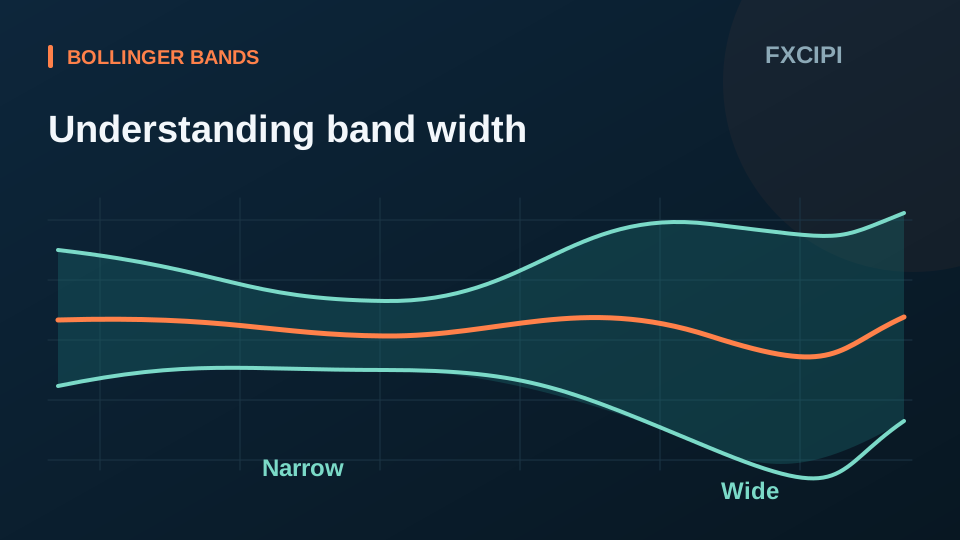
Bollinger Bands place an upper and lower band around a moving average using price standard deviation. Their width helps describe changes in volatility; touching a band does not determine the next direction.
Three lines, one context
The middle line is a moving average. The outer lines depend on the selected lookback and standard-deviation multiplier. Check the settings before comparing two charts.
Contraction and expansion
Narrower bands indicate lower measured variability over the selected window. Wider bands indicate higher measured variability. A narrow range does not establish the direction or timing of a later move.
Chart exercise
Find a section where the bands narrow, followed by a section where they widen. Compare the price movement while keeping the interval and settings unchanged. During a strong trend, price can remain close to one band.